 The median income of each state is shown in this thematic map of the United States. Each value range is given a color and the corresponding color is then assigned to the states. These maps are convenient when looking for a generalized value. http://www.visualizingeconomics.com/wp-content/uploads/census_2006income.gif
Sunday, December 7, 2008
Thematic Map
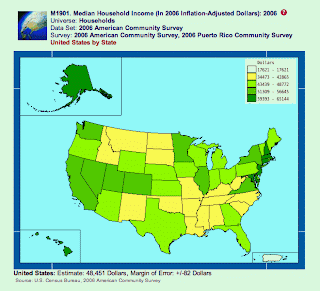
 The median income of each state is shown in this thematic map of the United States. Each value range is given a color and the corresponding color is then assigned to the states. These maps are convenient when looking for a generalized value. http://www.visualizingeconomics.com/wp-content/uploads/census_2006income.gif
Subscribe to:
Post Comments (Atom)
No comments:
Post a Comment