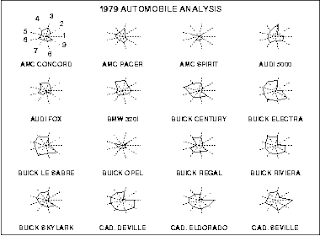
The star plot is a method of displaying multivariate data. This one is showing cars from 1979 and depicts different characteristics of each in the "points" of the star. Something interesting is that none of the cars had good gas mileage marks. http://www.itl.nist.gov/div898/handbook/eda/section3/starplot.htm
Monday, December 8, 2008
Correlation Matrix
A correlation matrix describes the strength and direction of a linear relationship between two random variables. This matrix describes the tissue to tissue correlation in livestock. http://www.livestockgenomics.csiro.au/Genome_to_Phenome/
Similarity Matrix
A similarity matrix is a matrix of scores which express the similarity between two data points. For this case the points of similarity are from the Bible and the languages it has been translated into. http://www.cse.iitb.ac.in/~prnv/html/html_sim/index.html
Stem and Leaf Plot
Stem and leaf plots are a method for showing the frequency with which certain classes of values occur. This plot shows the per capita GDP of Western Africa. http://mainland.cctt.org/mathsummer/JosephBond/StemAndPlots/stem-and-leaf_std.htm
Box Plot
Box plots are used to graphically display groups of numerical data through five number summaries. Here the graph is comparing two populations of people. http://www.bioinformaticszen.com/2007/10/comparing-two-populations-using-different-graph-types/
Histogram
This histogram is a tabulation of students and their final exam grades. That is exactly what a histogram depicts, tabulations of values and expressed in a graph. It seems quite a few students received A's and B's. http://searchsoftwarequality.techtarget.com/sDefinition/0,,sid92_gci330729,00.html
Parallel Coordinate Graph
This map is that of a parallel coordinate graph. These types of maps have each number plotted on a vertical coordinate to show different vales of different variables. http://www.iwi.uni-hannover.de/lv/seminar_ss05/bartke/geomet.htm
Subscribe to:
Posts (Atom)